Dear Friends,
Happy new year all. After taking a break a week or so, I am going to write tutorial about IDAPython especially about XRef. XRef function is a function to get where a function or data being referenced or called. Basically this function has been provided by IDA seamlessly by pressing x at the function or data you want to see
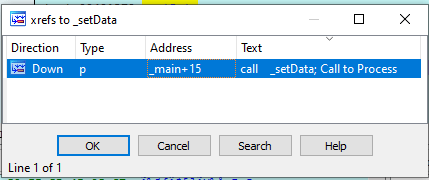
from the above screen we can see that _setData was referenced from only _main function where the exact position is _main+15. We can see that the assembly code that referencing this in text column call _setData;

In the direction column it is stated that the direction is down which mean the referencing code is below of the current.
Let do the python coding. This python coding below is intended to show the code of calling function when hitting the break point.
You can open python editon in IDA by following this step


def checkXref(): –> Function Name
rv = idaapi.regval_t() –> init rv as structure to hold register value
idaapi.get_reg_val(‘EIP’,rv) –> Read registry value from the current thread
ea = rv.ival –> Get the memory address 8 bytes
name = get_func_name(ea) –> Get the function name from the specified address
eaa = LocByName(name) –> Get the function address specified by Name
for addr in CodeRefsTo( eaa , 1): –> Get the reference to specified address
dism_addr = list(FuncItems(addr)) –> Get the address list of reference function
for line in dism_addr:
print hex(line), generate_disasm_line(line,0) –> Print the assembly code of the caller
print “==============”,get_func_name(line),”==============”
return True –> enable the break point stop
Next is to setup the break point. We will setup the break point in one of the body of function and set the break point to execute this code.
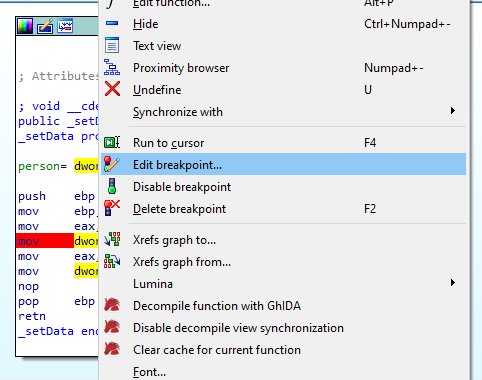
Set break point by pressing F2

Edit the breakpoint by right click on the break point and select edit breakpoint
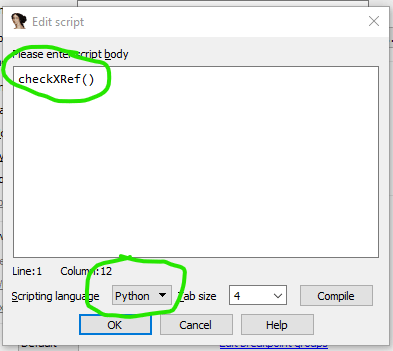
Select … to add the python code condition

Type the python code function that we created checkXRef() and change the scripting language to Python and press OK
Next is to run the application in debug mode and you will see in the output windows the python code is executed

OK.. now everytime the breakpoint is hit then it will trigger the python code which will list the xref function.
