Hey there, forensic enthusiasts!. I’m glad to share some insights about a tool I developed to assist with process forensic analysis—the Process Tree Analysis Tool. I created this desktop app to help analysts dive into process activity on Windows systems, making forensic investigations more effective. It’s a practical addition to your toolkit, and I’d love to walk you through its features and show how it can support your process analysis in a straightforward way.
What Does the Process Tree Analysis Tool Do?
The Process Tree Analysis Tool is an application I built to help forensic analysts better understand process activity. You start by uploading a CSV file containing process creation event data—like EventID 4688 logs—and the tool generates a process tree to show how processes are related. It also provides useful statistics and forensic metrics to give you a clearer picture of system activity. It’s a handy way to analyze process data, and I’m happy to share how it can streamline your investigations.
Feature 1: A Clear Process Tree Visualization
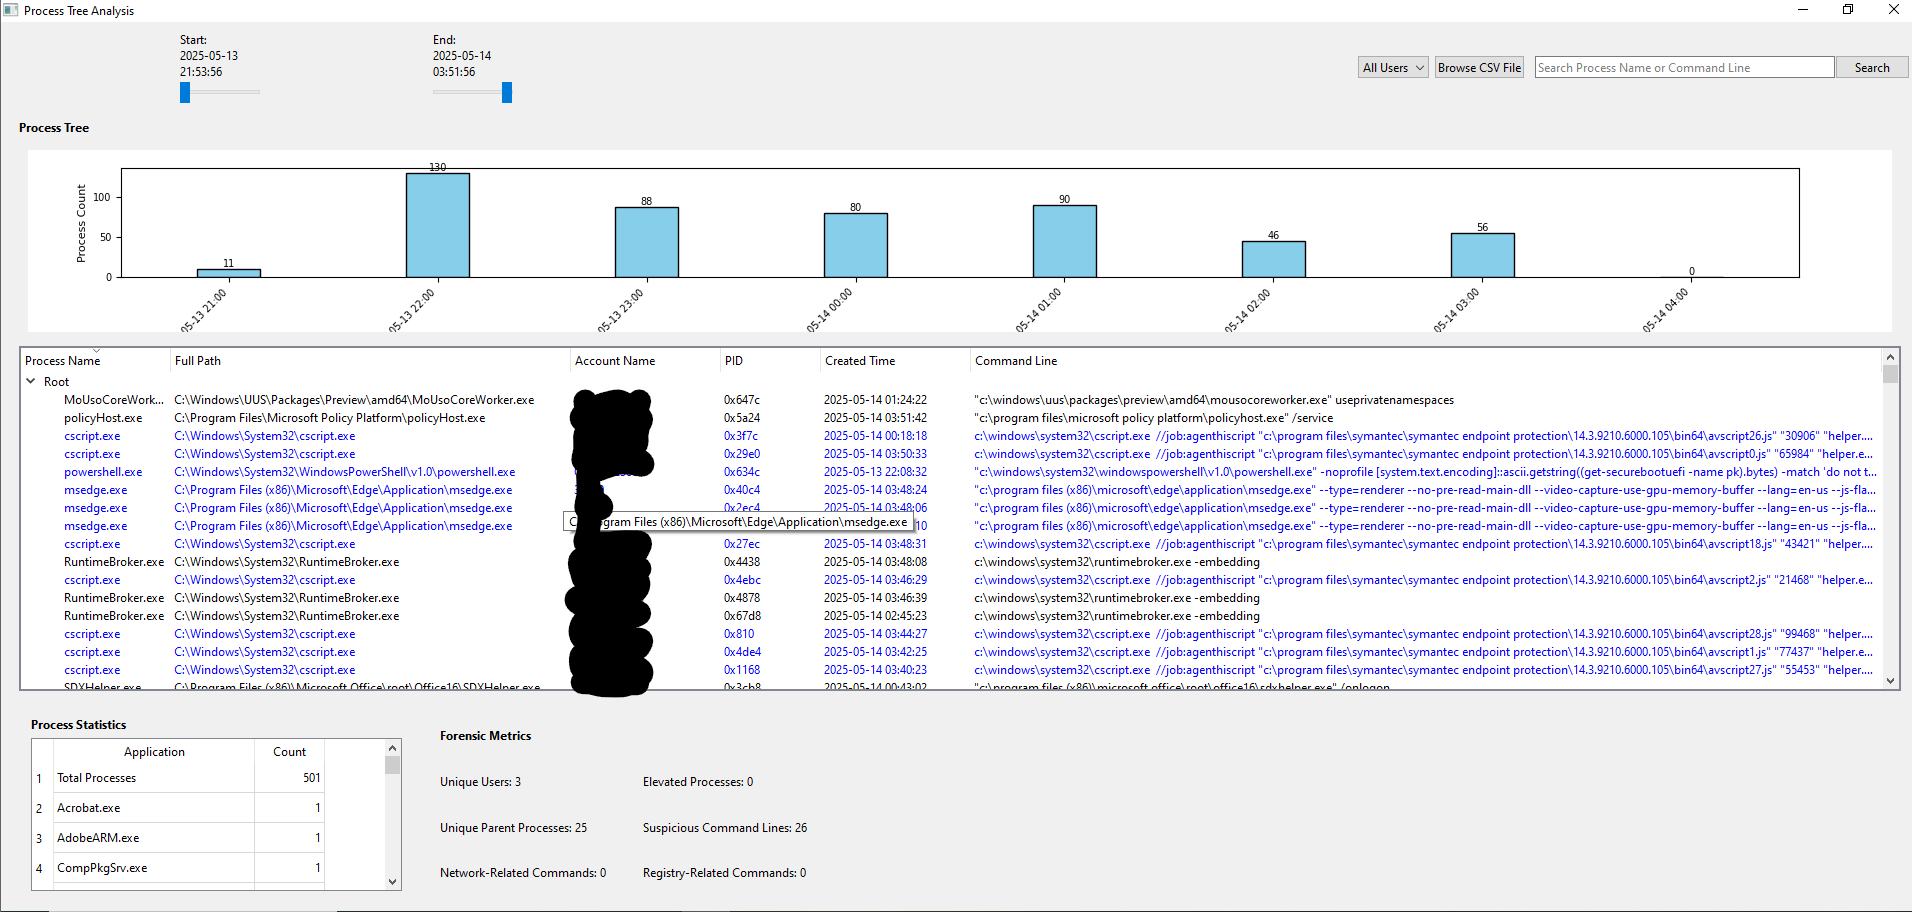
Let’s kick things off with the process tree visualization—a feature I designed to make understanding process relationships easier. The tool creates a tree that shows parent and child processes, helping you see how processes are connected within the system. Each entry in the tree includes helpful details like:
- Process Name: The executable name (e.g., “notepad.exe”).
- Full Path: The file’s location (e.g., “C:\Windows\System32\notepad.exe”).
- Account Name: The user account that started the process.
- PID: The process ID for further tracking.
- Created Time: When the process was launched.
- Command Line: The full command-line arguments used to start the process.
You can expand the tree to explore child processes, which is great for mapping out process activity. I also added visual cues—flagged processes appear in blue, and elevated ones (those with higher privileges) show up in red—to help you quickly spot processes that might need closer attention. It’s a practical way to get a clear view of process connections, making your analysis more focused.

Feature 2: Time Range Filtering with Simple Sliders
When you’re analyzing processes, focusing on the right timeframe can be crucial, and the time range filtering feature I included makes that easy. The tool has sliders that let you set a specific window of time to analyze. For example, if you’re interested in activity between 03:00 and 04:00 on May 14, 2025, you can adjust the sliders to zoom in on that period.
The sliders display the start and end times clearly (like “2025-05-14 03:00:00” to “2025-05-14 04:00:00”), so you always know what you’re looking at. This helps you reduce irrelevant data and focus on the events most relevant to your investigation. It’s a straightforward feature I added to save time and keep your analysis on track.

Feature 3: A Clickable Bar Chart for Hour-Based Filtering
The clickable bar chart is another feature I’m pleased to have included—it adds a lot of value to your analysis. Positioned above the process tree, this chart shows how many processes were created each hour within your selected time range. Each bar represents an hour (like “03:00”), with the height indicating the number of processes started during that hour.
You can click on a bar to filter the process tree to just that hour’s processes. For instance, clicking “03:00” will show you all the processes that started between 03:00:00 and 03:59:59—such as ones at 03:48 or 03:32. It’s a convenient way to narrow your focus to a specific hour. To clear the filter, just double-click the chart, and you’re back to the full view. I made sure the chart adjusts to fit the window nicely, making it a practical tool for zeroing in on key time periods.

Feature 4: User Filtering to Narrow Your Scope
The user filtering feature I added is a useful way to focus on specific user activity. The tool extracts all usernames from your CSV data and populates a dropdown menu, with “All Users” as the default option. You can select a specific user—like “Administrator”—to see only the processes they initiated, across the tree, stats, and chart.
This is helpful because process activity can vary significantly between users, especially if you’re investigating unusual behavior tied to a specific account. Filtering by user lets you see what a particular account has been up to. I placed the dropdown on the right side of the top bar, next to the “Browse CSV File” button, so it’s easy to access. It’s a simple feature that helps you keep your investigation targeted.

Feature 5: Search and Highlight for Quick Spotting
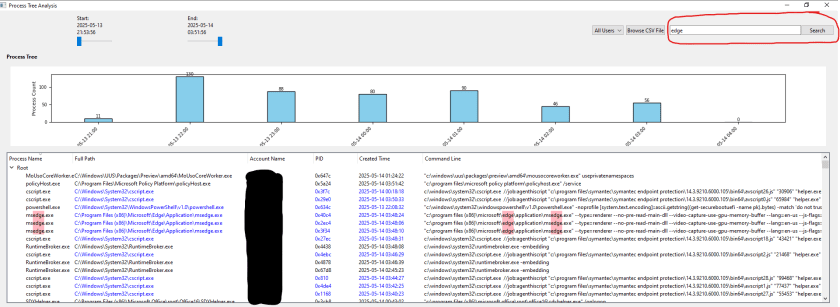
The search and highlight feature I included is a nice touch for finding specific details quickly. There’s a search bar where you can type keywords (like “notepad”) to search the “Process Name” and “Command Line” columns in the tree. Matches are highlighted with a pink background, so they stand out clearly.
For example, searching for “edge” will highlight “msedge.exe” in the tree, helping you locate relevant processes fast. It’s a straightforward way to find what you’re looking for, and the pink highlight ensures you don’t miss anything important. This feature is great for speeding up your analysis by pointing you straight to key processes.

Feature 6: Process Stats and Forensic Metrics for Deeper Insights
The Process Statistics and Forensic Metrics sections I designed give you a solid overview of process activity. The Process Statistics table lists all the applications and how many times they ran within your filters. For instance, you might see “notepad.exe” ran 3 times, giving you a sense of its activity level.
The Forensic Metrics section provides key details like:
- Unique Users: How many different user accounts were involved.
- Elevated Processes: How many processes had higher privileges.
- Unique Parent Processes: The number of unique parent processes.
- Suspicious Command Lines: Processes with commands that might raise concerns (like “powershell” or “cmd”).
- Network-Related Commands: Commands tied to network activity (like “curl” or “wget”).
- Registry-Related Commands: Commands affecting the registry (like “reg add”).
These metrics help you understand the system’s state and identify patterns in process behavior. I also ensured the tool flags processes that match a list of known living-off-the-land binaries, showing them in blue in the stats table. It’s a practical way to gather insights and make informed decisions during your investigation.

How This Tool Makes Process Forensic Analysis More Effective
I developed the Process Tree Analysis Tool to help make process forensic analysis more effective, and here’s how it supports your work:
- Better Insight into Process Relationships: The process tree shows how processes are connected, so you can trace activity back to its source and understand system behavior.
- Focused Filtering Options: With time sliders, user filtering, and the clickable bar chart, you can narrow your investigation to specific events, users, or hours, helping you focus on relevant data.
- Easier Identification of Key Processes: Features like search and highlight, flagging, and forensic metrics make it simpler to spot processes of interest—like those with unusual command lines or elevated privileges.
- Solid Overview of System Activity: The stats and metrics give you a clear picture of what’s happening, helping you assess process activity and plan your next steps.
- Straightforward to Use: I designed the app to be user-friendly, with clickable charts, dropdowns, and visual highlights that make it easy to navigate, whether you’re new to forensics or a seasoned analyst.
- Supports Reporting Needs: It helps you document process connections, timestamps, and metrics, which can be useful for creating reports for audits or compliance purposes.
Wrapping Up
The Process Tree Analysis Tool, which I developed, is a helpful companion for anyone working on process forensic analysis. With its clear process tree, clickable bar chart, practical filtering options, and detailed metrics, it makes investigating process activity more effective and manageable. Whether you’re analyzing system behavior, identifying unusual processes, or preparing a report, this tool can support your efforts in a straightforward way. I’m glad to have created this app to assist with your investigations—give it a try and see how it can help with your next analysis!
